Data Analyst vs. Data Scientist vs. Data Engineer: Which to Choose
· updated
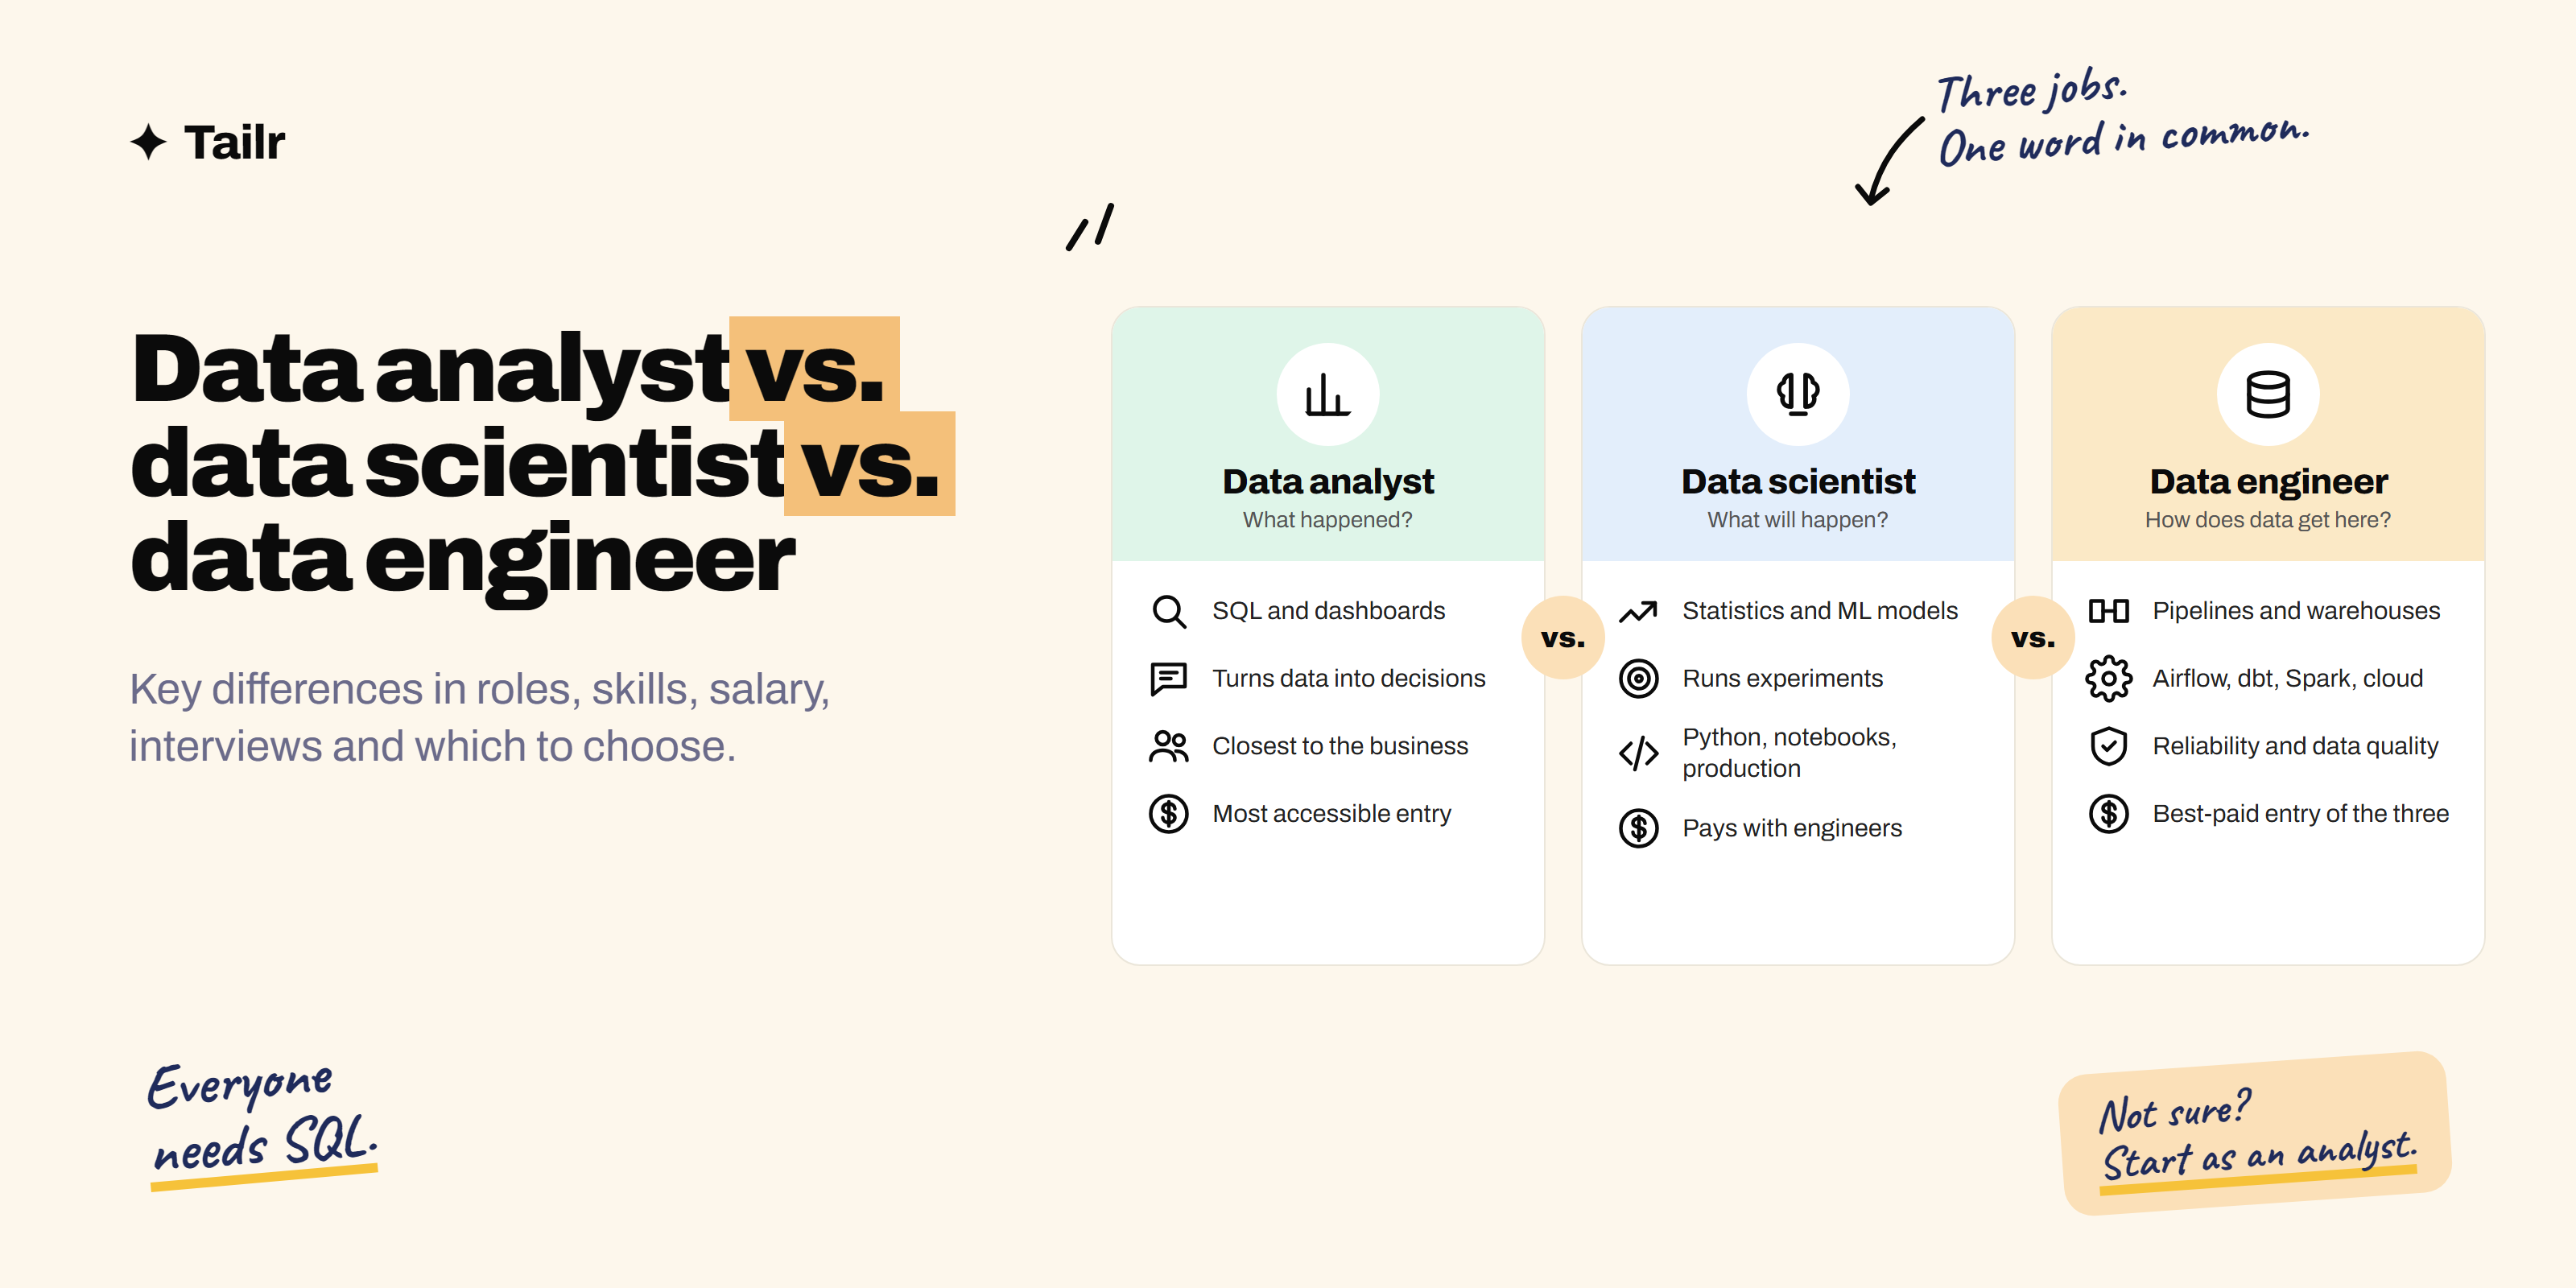
“I want to work with data” is where a lot of careers start, and it’s where a lot of confusion starts too, because the three main data jobs share tools, share the word “data”, and differ in almost everything else: what a day looks like, what you need to know, what the interview asks, and what it pays. This is the comparison to read before you pick a path or apply for a title you’re not sure you’re qualified for.
The short answer: the three roles answer different questions:
- Data analyst: “what happened and why”, with SQL, dashboards and business judgement, turned into decisions.
- Data scientist: “what will happen” and “what should we do”, with statistics, machine learning and experiments.
- Data engineer: “how does the data get here reliably”, by building the pipelines, warehouses and infrastructure the other two depend on.
Analyst is the most accessible entry and pays least; engineer and scientist pay similarly and well above analyst at every level. All three need SQL. The most common career moves are analyst to analytics engineer or scientist, and engineer toward platform or ML infrastructure.
The three roles side by side
| Data analyst | Data scientist | Data engineer | |
|---|---|---|---|
| Core question | What happened, and why? | What will happen, and what should we do? | How does the data get here, correctly, every day? |
| Main output | Dashboards, reports, analyses, recommendations | Models, experiments, forecasts, causal analyses | Pipelines, warehouses, data models, platforms |
| Closest to | The business and its decisions | Product and research questions | Systems and other engineers |
| Core tools | SQL, spreadsheets, Tableau or Power BI or Looker, some Python | Python or R, SQL, notebooks, scikit-learn, statistics libraries, experimentation platforms | SQL, Python or Scala, Airflow, dbt, Spark, Kafka, cloud warehouses, Docker, Terraform |
| Maths needed | Descriptive statistics, basic inference | Statistics, probability, linear algebra, ML theory | Little; engineering rigour instead |
| Codes? | Some; SQL daily, Python occasionally | Yes, in notebooks and increasingly in production | Yes, at software engineering level |
| Measured on | Decisions influenced, accuracy, speed to insight | Model performance, experiment rigour, business impact | Reliability, latency, data quality, cost |
| Typical background | Any degree plus SQL; business, economics, STEM | STEM degree, often a master’s; strong stats | Computer science or software engineering |
What a week actually looks like
Data analyst. Monday: the head of sales wants to know why conversion dropped last week. You write six SQL queries, find it’s one region and one campaign, and send a three-line answer with a chart. Tuesday: building the monthly board dashboard in Looker, which mostly means arguing about definitions of “active customer”. Wednesday: a deep dive on churn by segment that becomes a ten-slide deck. Thursday: someone’s spreadsheet doesn’t match the dashboard; you reconcile it and find a time zone bug. Friday: refinement with product, asking what question the new feature’s tracking is supposed to answer before it’s built.
Data scientist. Monday: the A/B test on the new onboarding flow has run for two weeks; you check the power, the guardrail metrics and the novelty effect before calling it. Tuesday: feature engineering for a churn model, mostly SQL and pandas, mostly cleaning. Wednesday: training and comparing three models, and finding that the simple one is nearly as good and much easier to explain. Thursday: presenting the model to the retention team and translating “AUC of 0.81” into “we can find 60 percent of churners if we contact the top 20 percent”. Friday: pairing with an ML engineer to get the model into the scoring pipeline, and writing the monitoring plan.
Data engineer. Monday: the nightly load into the warehouse failed at 3am because a source API changed a field type; you fix the ingestion, backfill, and add a schema check so it alerts instead of failing next time. Tuesday: designing the data model for a new product event stream, arguing about grain and late-arriving data. Wednesday: migrating a set of dbt models to incremental so the daily run drops from two hours to twenty minutes. Thursday: reviewing the analysts’ SQL for the models that will become official metrics, and writing tests for them. Friday: cost review; one query pattern is 40 percent of the warehouse bill, and you fix it with clustering.
Skills and tools
Everyone needs: SQL, properly. Joins, aggregation, window functions, and the judgement to know when a number is wrong. 50 SQL interview questions is the level all three interviews expect.
Data analyst adds
- Spreadsheets at an expert level (pivot tables, lookups, modelling).
- A BI tool: Tableau, Power BI, Looker, Metabase. Dashboard design that people actually use.
- Descriptive statistics and enough inference to know when a difference is noise.
- Python or R for anything SQL can’t do, usually pandas.
- Business understanding: how the company makes money, what the metrics mean, who decides what.
- Communication: the three-line answer, the chart that makes the point, the deck the executive reads.
Data scientist adds
- Python (or R) at a working software level: pandas, NumPy, scikit-learn, a plotting library, and increasingly PyTorch or a gradient-boosting library.
- Statistics and probability: hypothesis testing, confidence intervals, Bayesian basics, regression, causal inference.
- Machine learning: supervised and unsupervised methods, evaluation, cross-validation, feature engineering, and knowing when not to use ML.
- Experimentation: A/B test design, power, guardrails, sequential testing, common pitfalls.
- Enough engineering to get a model into production or work with someone who can.
- Explaining models and uncertainty to people who will make decisions on them.
Data engineer adds
- Software engineering: Python or Scala, Git, testing, code review, CI.
- Data modelling: dimensional models, event schemas, grain, slowly changing dimensions.
- Pipeline orchestration: Airflow, Dagster, Prefect; transformation with dbt.
- Distributed processing: Spark, and streaming with Kafka or a managed equivalent.
- Cloud data platforms: a warehouse (Snowflake, BigQuery, Redshift, Databricks), object storage, IAM, cost management.
- Infrastructure: Docker, Terraform, monitoring and alerting.
- Data quality: tests, contracts, lineage, observability.
What each role pays
Data engineers and data scientists earn well above data analysts at every level; the gap between engineers and scientists is small and varies by company.
- United States: entry-level data analysts roughly $60,000 to $80,000; mid-level $80,000 to $110,000; senior analysts and analytics managers to around $130,000. Entry-level data engineers roughly $90,000 to $120,000; mid-level $120,000 to $160,000; senior $160,000 to $200,000 and above. Data scientists run close to engineers: entry roughly $95,000 to $115,000, mid $120,000 to $150,000, senior $160,000 to $200,000 and above, higher at companies with strong research cultures. Machine learning engineering, the production end of data science, sits above both.
- United Kingdom and Europe: analysts roughly £30,000 to £60,000; engineers and scientists roughly £45,000 to £100,000, with London, fintech and remote-US roles at the top.
- India: analysts roughly 4 to 15 lakhs; data engineers roughly 6 to 30 lakhs; data scientists roughly 6 to 35 lakhs, with product companies and US-funded startups paying well above these for senior roles.
What pushes pay up in all three: a track record with numbers attached (a pipeline that cut costs, a model that moved a metric, an analysis that changed a decision), and cloud or production experience. What holds it down: dashboards nobody uses, models that never shipped, and pipelines nobody else can run.
Career paths from each role
From data analyst: senior analyst, analytics manager, head of analytics. Sideways into analytics engineering (the most common technical step: SQL modelling with software practices, usually dbt), product analytics, product management, finance or strategy. Upward into data science with added statistics and Python.
From data scientist: senior and staff data scientist, research scientist, machine learning engineer (the production path), applied scientist, head of data science. Sideways into product management or AI engineering, where the model is an API and the work is the product around it.
From data engineer: senior and staff data engineer, data platform engineer, ML platform or MLOps engineer, data architect, head of data engineering. Sideways into backend engineering, site reliability, or analytics engineering if you prefer the modelling end.
The analytics engineer role sits between analyst and engineer and is where a lot of the movement happens in both directions.
How the interviews differ
Data analyst: a SQL test, usually live or take-home, at the level of joins, window functions and the classic problems. A case: “conversion dropped 10 percent last week, how would you investigate?” A presentation of a past analysis or a take-home dataset. Questions about metrics: define “active user”, explain a funnel, spot the flaw in a chart. Business sense and communication are weighted as much as technique.
Data scientist: SQL, then Python coding (pandas manipulation, a small algorithm). Statistics: explain a p-value, design an A/B test, when would you use a t-test versus a non-parametric test, what’s a confounder. Machine learning: explain a model you’ve built end to end, bias-variance, evaluation metrics for imbalanced data, how you’d handle leakage. A case or take-home with real data, and a presentation. Product sense at product companies.
Data engineer: SQL, then a coding round in Python at software engineering level. Data modelling: design a schema for this business; explain grain; handle late data. Pipeline design: build an ingestion for this source; how do you make it idempotent; what happens when the source changes. System design: a warehouse for this scale, batch versus streaming, cost. Debugging: this pipeline failed, walk me through it. Behavioral questions about working with analysts and product teams.
For the non-technical rounds all three share, 40 behavioral interview questions with sample answers covers the questions data teams lean on most.
Which one should you choose?
Choose data analyst if:
- You like understanding how a business works and influencing decisions more than building systems.
- You’re strong on communication and can make a chart that changes someone’s mind.
- You want the most accessible entry into data, with the option to specialise later.
- You don’t want to be measured on code quality.
Choose data scientist if:
- You enjoy statistics and modelling, and you’re honest about uncertainty.
- You have or are willing to get the maths: probability, inference, ML theory.
- You want to run experiments and build models that ship, and you’re prepared to learn enough engineering to ship them.
- You accept that the generalist version of the role is harder to get than it was, and you’ll specialise.
Choose data engineer if:
- You’re a software engineer at heart and data is the domain you find interesting.
- You like systems, reliability, and problems like “this must run correctly every night at scale”.
- You want the strongest pay at entry level of the three and a clear path to platform and infrastructure roles.
- You’d rather build the thing everyone depends on than present to the board.
If you’re not sure: start as an analyst. It’s the most accessible, it teaches you what the business actually needs from data, and from there both other roles are reachable with deliberate skill-building. The analytics engineer role is a natural first step toward engineering, and a statistics-heavy analyst role is a natural first step toward science.
Tailoring your resume for each role
The same project reads differently depending on the title you’re applying for.
For an analyst listing, lead with decisions influenced and the business outcome: “analysis of checkout drop-off led to a form redesign that lifted conversion 8 percent”. Name the BI tool and SQL in the first lines. Show you can communicate.
For a data scientist listing, lead with models and experiments, with evaluation and impact: “built a churn model (gradient boosting, AUC 0.84) that targets retention outreach; reduced churn in the treated group by 12 percent in an A/B test”. Name Python, the libraries, and the statistical methods.
For a data engineer listing, lead with systems and reliability: “built the event ingestion pipeline (Kafka, Spark, Snowflake) handling 200M events a day with 99.9 percent on-time delivery; cut warehouse cost 30 percent by redesigning the model”. Name the stack, the scale and the engineering practices.
Tailr does this from the job listing itself: it tailors your resume to the specific analyst, scientist or engineer role you’re viewing, so the version of your experience that listing wants is the one on the page, with a matching cover letter. How to tailor your resume to a job description explains the method. Try Tailr on the next data listing you open.
Conclusion
A data analyst explains what happened, a data scientist predicts what will happen, and a data engineer makes sure the data is there for both. They share SQL and the word “data” and differ in nearly everything else: the daily work, the maths, the code, the interview and the pay. Pick the one that fits how you like to work, know that analyst is the most accessible door and engineer the best-paid entry, and describe your experience in the language of the role you’re applying for. The moves between them are well-worn; the mistake is applying for a title without the skills the interview will test.
Frequently asked questions
01What is the difference between a data analyst, a data scientist and a data engineer?
A data analyst answers questions about what happened and why, using SQL, spreadsheets and dashboards, and turns the answer into a decision. A data scientist builds models that predict or classify, using statistics and machine learning, and runs experiments. A data engineer builds and maintains the pipelines, warehouses and infrastructure that get data to the other two reliably. Analyst is closest to the business, engineer is closest to the systems, scientist sits between.
02Which pays more: data analyst, data scientist or data engineer?
Data engineers and data scientists both earn well above data analysts at every level. In the US in 2026, entry-level analysts average roughly $60,000 to $80,000, entry-level engineers and scientists roughly $90,000 to $120,000. At senior level, engineers and scientists are close, with engineers slightly ahead in many datasets on base salary and scientists ahead at companies with a strong research culture. Analysts top out lower unless they move into analytics engineering or management.
03Which data role is best for a fresher?
Data analyst is the most accessible: SQL, a spreadsheet, a BI tool and business sense will get you interviews, and the role teaches you how the business actually uses data. Data engineering is the best-paid entry if you can code and like systems. Data science straight from a degree is harder than it was; most entry-level data science roles now want either a master's or real project experience with deployed models.
04Can a data analyst become a data scientist or data engineer?
Yes, both are common moves. Analyst to data scientist means adding statistics, Python and machine learning, and usually a project where you built and evaluated a model on real data. Analyst to data engineer means adding Python, data modelling, orchestration tools and cloud infrastructure. Analytics engineer is the halfway role that many analysts move into first, combining SQL modelling with software practices.
05What skills do you need for each data role?
All three need SQL. Analysts add spreadsheets, a BI tool like Tableau or Power BI, statistics basics, and communication. Scientists add Python or R, statistics and probability, machine learning, experimentation, and the ability to explain models. Engineers add Python or Scala, data modelling, pipeline orchestration like Airflow or dbt, cloud platforms, and software engineering practices like testing and version control.
06Is data science still a good career in 2026?
Yes, but it has split. Generalist data science roles have become harder to get and the title has been partly absorbed by analytics on one side and machine learning engineering on the other. Data scientists who can deploy models, run rigorous experiments, or specialise in a domain are in strong demand. Those whose skill is building notebook models that never ship are not.