What Is A/B Testing? A Beginner's Guide With Examples
· updated
A/B testing is how a lot of the internet gets decided. The colour of a button, the wording of a sign-up page, the order of steps in an app’s onboarding: many of these were chosen because one version beat another in a test with real users. It’s also one of the most common topics in product manager, marketing, growth and data analyst interviews. This guide explains A/B testing in plain English, walks through a real example, and covers the mistakes that make tests lie.
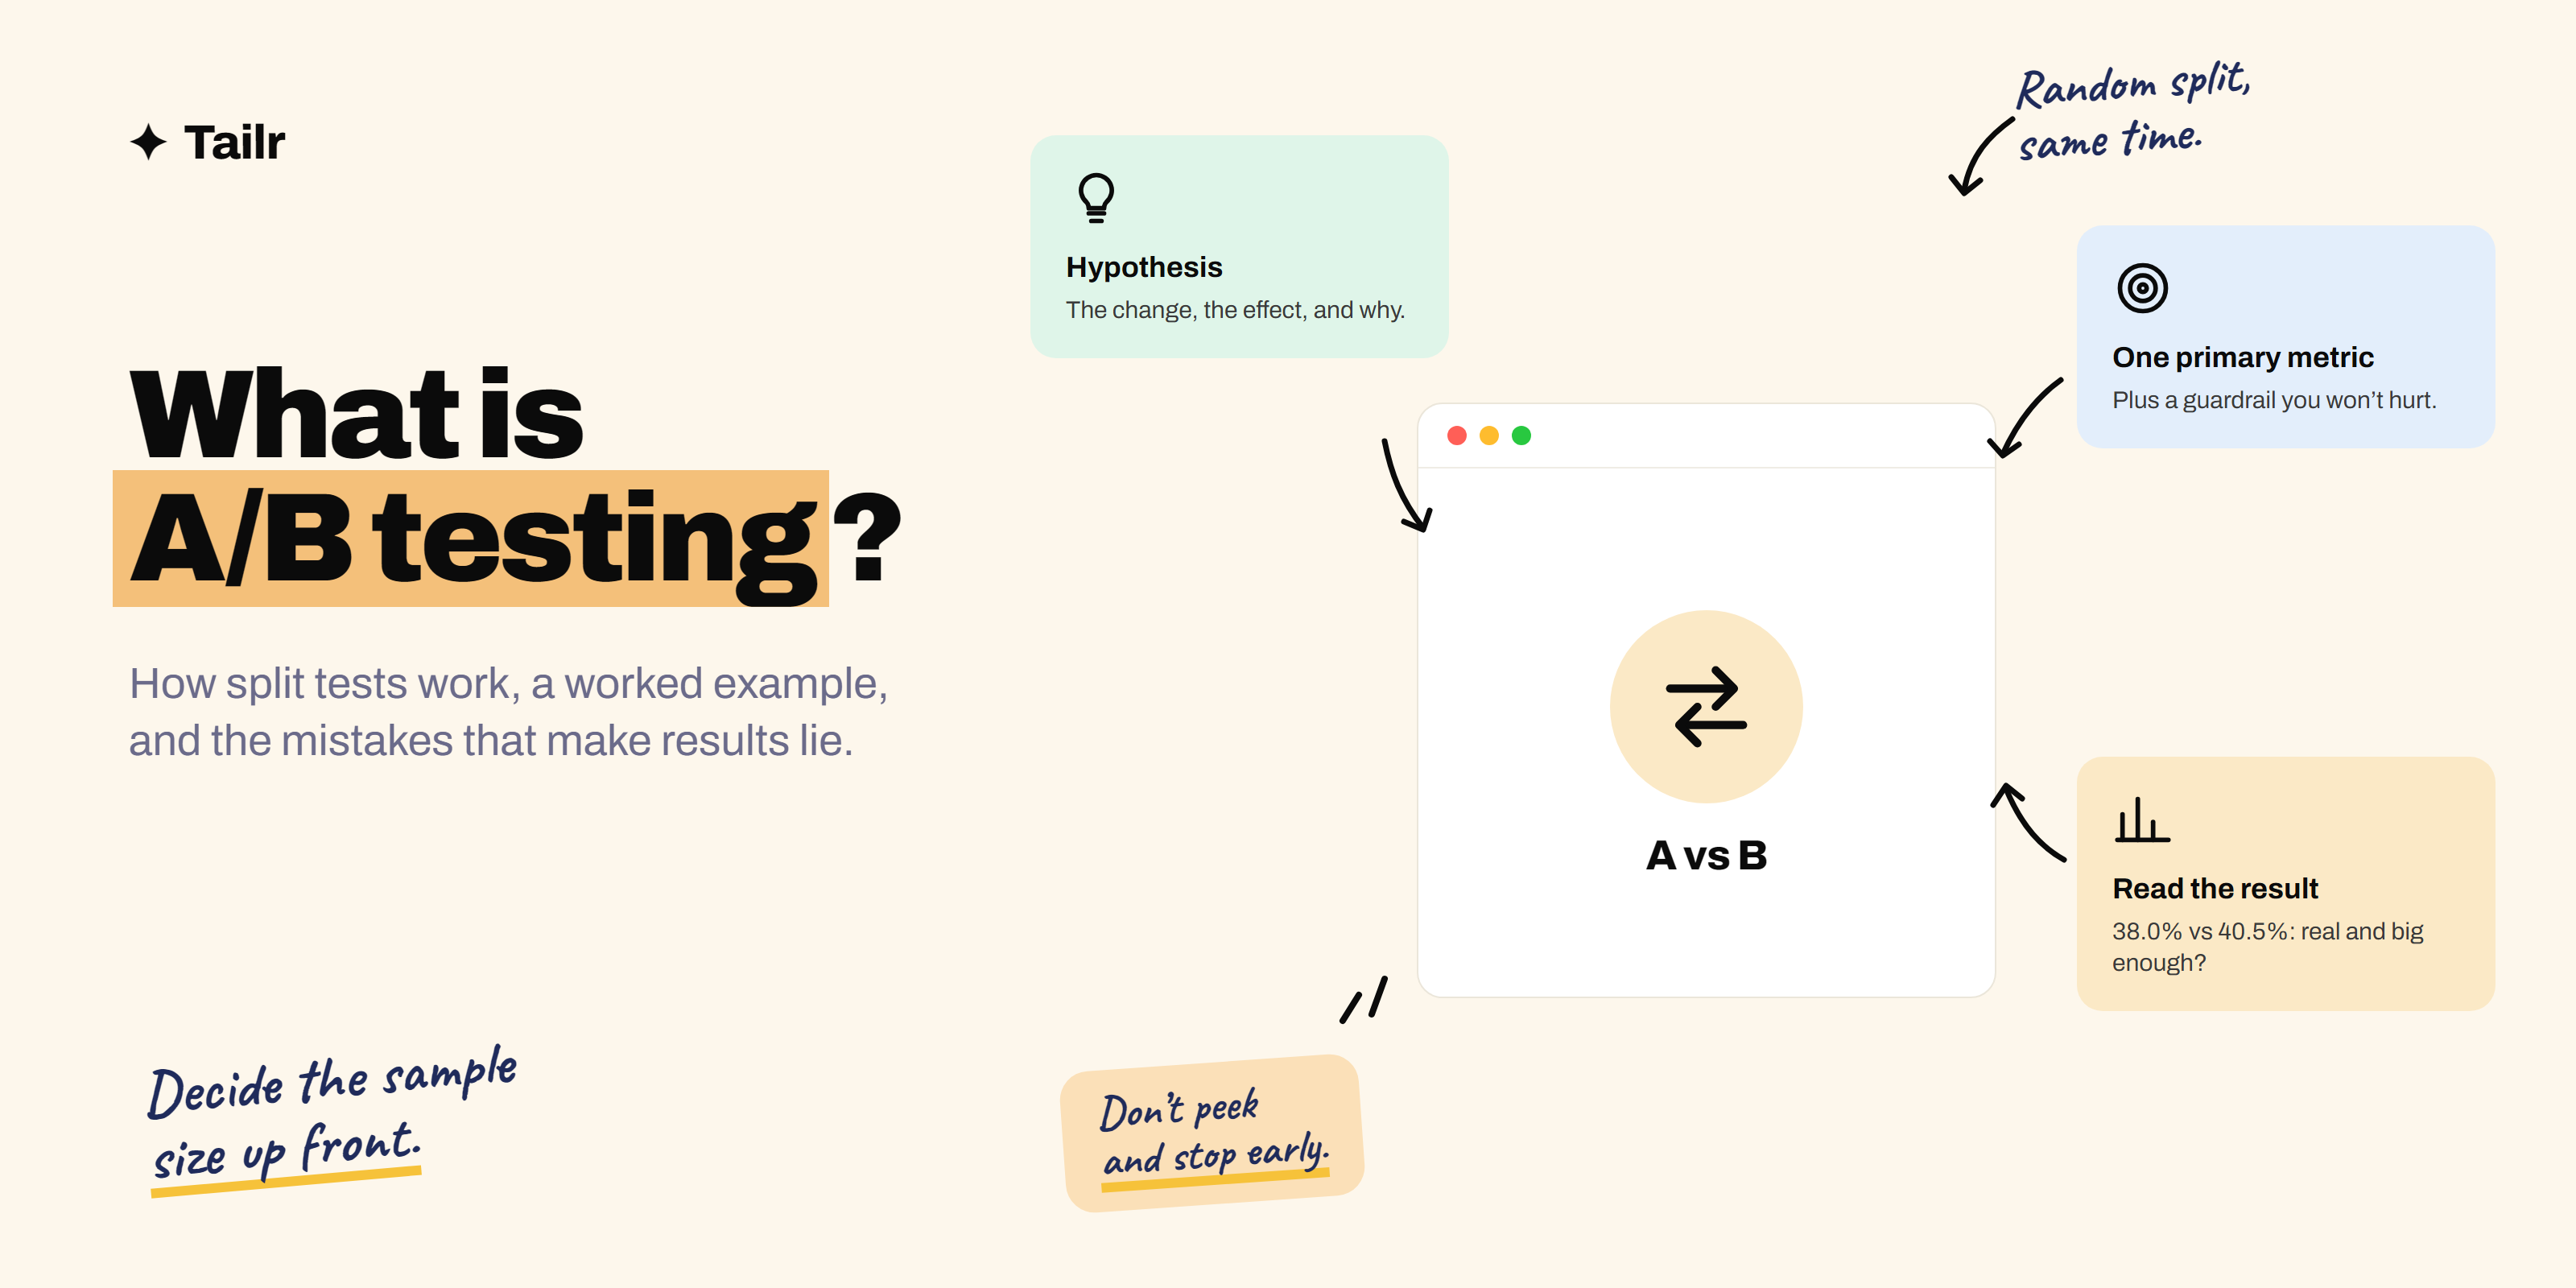
The short answer: A/B testing (also called split testing) is a way to compare two versions of something by showing each to a random group of users at the same time and measuring which performs better. It works in five steps:
- Form a hypothesis: “Showing the delivery date near the pay button will increase completed purchases.”
- Pick one primary metric (and a guardrail metric you don’t want to hurt).
- Split users randomly into group A (the control, the current version) and group B (the variant, the change).
- Run the test until you reach the sample size you planned, for at least one or two full weeks.
- Compare the results and ship B only if it wins by a reliable, meaningful margin.
Why A/B testing matters
Opinions are cheap and often wrong. Even experienced designers and product managers are regularly surprised by which version wins. A/B testing replaces “I think” with “we measured”, which helps teams:
- Make decisions with evidence, not by whoever argues loudest.
- Measure the real impact of a change, separated from seasonality, marketing campaigns and news.
- Ship with less risk, because a bad change only reaches half the users for a short time.
- Learn about users, since even a losing test tells you something about what people care about.
The key word is random. Because both groups are chosen at random and run at the same time, anything else going on in the world affects both equally. The only systematic difference between them is the change you made. That’s what lets you say the change caused the result.
A/B testing example, step by step
Let’s walk through a test at an imaginary online plant shop.
1. Spot the problem
Analytics show that 62% of people who reach the checkout page leave without paying. Customer emails suggest people aren’t sure when their plants will arrive.
2. Write a hypothesis
“If we show the estimated delivery date directly above the pay button, more checkout visitors will complete their purchase, because uncertainty about delivery is causing drop-off.”
A good hypothesis names the change, the expected effect and the reason.
3. Choose metrics
- Primary metric: checkout conversion rate (purchases ÷ checkout visitors).
- Guardrail metrics: average order value and customer support contacts about delivery. You don’t want more purchases at the cost of smaller baskets or angry customers when plants arrive later than shown.
4. Work out the sample size
Current conversion is 38%. The team decides a lift to 40% (two percentage points) would be worth having. Plugging those numbers into a sample size calculator at the usual settings (95% confidence, 80% power) gives roughly 9,000 to 10,000 checkout visitors per group. The shop gets about 1,500 checkout visitors a day, so the test needs about two weeks.
5. Run the test
Visitors are randomly assigned to A (current page) or B (delivery date shown). Each person stays in the same group if they come back. The team doesn’t touch the test or stop it early, even when B looks ahead on day three.
6. Read the results
After two weeks:
| Visitors | Purchases | Conversion | |
|---|---|---|---|
| A (control) | 10,200 | 3,876 | 38.0% |
| B (delivery date) | 10,150 | 4,111 | 40.5% |
The difference is statistically significant, average order value didn’t change, and delivery-related support contacts dropped slightly. B ships to everyone.
7. Share what you learned
The team writes a short summary: the hypothesis, the result and the insight (“delivery certainty matters at checkout”), which leads to the next test: showing delivery dates on product pages too.
Key A/B testing terms in plain English
| Term | What it means |
|---|---|
| Control (A) | The current version, used as the baseline |
| Variant (B) | The new version you’re testing |
| Hypothesis | What you expect to happen and why |
| Primary metric | The one number that decides the winner |
| Guardrail metric | A number you watch to make sure you aren’t causing harm elsewhere |
| Conversion rate | The share of users who complete the action you care about |
| Sample size | How many users each group needs for a reliable result |
| Statistical significance | The difference is unlikely to be random chance; often a p-value below 0.05 |
| Confidence interval | The range the true effect probably falls in, such as “+1.2 to +3.8 points” |
| Statistical power | The chance your test detects a real effect if there is one; 80% is a common target |
| Minimum detectable effect | The smallest improvement you’ve designed the test to reliably detect |
| Lift | How much better (or worse) B did compared with A, usually as a percentage |
Significance vs importance
A result can be statistically significant and still not matter. With millions of users, a 0.05% improvement can be “significant” but not worth the engineering cost to maintain. Always ask two questions: is it real? (significance) and is it big enough to care about? (practical importance).
How to calculate conversion rate and lift
Two calculations come up constantly, in real tests and in interviews.
Conversion rate = conversions ÷ visitors × 100
Using the plant shop numbers: A converted 3,876 ÷ 10,200 = 38.0%, and B converted 4,111 ÷ 10,150 = 40.5%.
Absolute difference = 40.5% − 38.0% = 2.5 percentage points.
Relative lift = (B − A) ÷ A × 100 = 2.5 ÷ 38.0 × 100 ≈ 6.6%.
Be precise about which one you mean. “Conversion went up 2.5%” is ambiguous: it could mean 2.5 percentage points (from 38% to 40.5%) or a 2.5% relative lift (from 38% to about 39%). In interviews and reports, say “percentage points” for the absolute difference and “relative lift” for the percentage change.
Explaining a p-value in plain English
Interviewers love asking you to explain this without jargon. Try:
“The p-value tells us how surprising our result would be if there were actually no difference between A and B. A p-value of 0.01 means that if the change truly did nothing, we’d see a difference this big only about 1% of the time by chance. Because that’s unlikely, we conclude the difference is probably real.”
What a p-value is not: it isn’t the probability that B is better, and it doesn’t tell you how big the improvement is. For size, look at the confidence interval.
A simple A/B test checklist
Before you start:
- Written hypothesis with a reason
- One primary metric and at least one guardrail
- Sample size and test length calculated
- Randomisation unit chosen (user, session or account)
- Tracking checked in both versions
While it runs:
- Split ratio looks right (roughly 50/50)
- No changes to either version mid-test
- No stopping early
After it ends:
- Significance and confidence interval checked
- Guardrails reviewed
- Results checked for key segments (new vs returning users, mobile vs desktop)
- Decision and learnings written down
What can you A/B test?
- Websites: headlines, page layouts, calls to action, pricing page structure, forms.
- Apps: onboarding steps, feature placement, notifications, default settings.
- Emails: subject lines, send times, content and layout.
- Ads: images, copy and audiences.
- Product features: a new recommendation algorithm, a redesigned search, a new paywall.
- Pricing and packaging, carefully and ethically.
Common A/B testing mistakes
Peeking and stopping early
If you check results every day and stop the moment B looks better, you’ll often “find” winners that aren’t real. Random noise makes early results swing wildly. Decide the sample size up front and wait for it, or use a testing method specifically designed for checking as you go.
Too little traffic
With a few hundred users, only enormous differences can be detected reliably. If your sample size calculation says you’d need six months, the test isn’t worth running. Use user research, or test a bigger, bolder change.
Testing too many things at once
If B changes the headline, the image and the button at the same time and wins, you don’t know which change mattered. That’s fine if you only care about the overall result, but it limits what you learn.
Ignoring guardrails
A pushier pop-up may increase sign-ups while increasing unsubscribes and complaints. Without guardrail metrics, you’d ship something that hurts the business.
Novelty effects
Users sometimes click on something just because it’s new. Run tests long enough for the novelty to wear off, especially for changes to familiar parts of a product.
Not checking the split
If group A has 10,000 users and group B has 8,000 when the split should be 50/50, something’s broken in the assignment or tracking. This is called a sample ratio mismatch, and it makes results untrustworthy.
Testing tiny things forever
Button colour tests are famous, but they rarely move a business much. The biggest wins usually come from testing meaningful changes to the user’s experience.
A/B testing vs other methods
| Method | What it’s for |
|---|---|
| A/B test | Measuring whether a specific change causes a better result |
| Multivariate test | Testing combinations of several changes at once; needs lots of traffic |
| A/B/n test | Comparing three or more versions against a control |
| User interviews and usability tests | Understanding why people behave a certain way; small samples, rich insight |
| Before-and-after comparison | Cheap, but can’t separate your change from everything else that happened |
| Feature flag rollout | Releasing to a small percentage of users to catch problems, not necessarily to measure impact |
Good teams use research to come up with ideas and A/B tests to check which ideas actually work.
How A/B testing comes up in interviews
Product manager interviews
- “How would you test whether this feature works?” Describe the hypothesis, primary and guardrail metrics, randomisation unit (user, session, account), how long you’d run it and how you’d decide.
- “The test shows B increased clicks but decreased revenue. What do you do?” Talk about which metric matters most for the goal, segment the results, and look for why.
- “When wouldn’t you A/B test?” Low traffic, obvious bug fixes, big strategic bets, or tests that would treat users unfairly.
For the vocabulary around these questions, see 10 terms you should know before a product management interview and DAU, MAU, retention and churn explained.
Data analyst and marketing interviews
Expect questions on calculating conversion rates, reading a results table, explaining p-values in plain English, and spotting problems like peeking or a broken split. If you’re preparing for analyst roles, our SQL interview questions cover the queries behind most experiment analysis.
A/B test your job search
The same idea works on your applications. If you’re applying to similar roles, try two versions of your resume summary or cover letter opening, keep everything else the same, and track which one gets more replies over 20 or 30 applications. It’s not a perfectly controlled experiment, but it beats guessing.
To do that you need to keep track of which version went where. Tailr is a Chrome extension that tailors your resume to the job listing you’re viewing, writes a matching cover letter and tracks every application, so you can see what’s working.
Try TailrConclusion
A/B testing compares two versions with randomly split users to find out which one really performs better. Start with a clear hypothesis, pick one primary metric and a guardrail, work out the sample size before you begin, and resist stopping early. Done well, it turns product debates into evidence, and it’s one of the most useful skills you can bring to a product, growth or analytics interview.
Frequently asked questions
01What is A/B testing in simple terms?
A/B testing means showing two versions of something, such as a web page, button or email, to two random groups of users at the same time, and measuring which version performs better on a chosen metric. Version A is usually the current design (the control) and version B is the change you want to test.
02What is an example of an A/B test?
An online shop shows half its visitors a checkout page with the delivery date displayed above the pay button and the other half the usual page. After two weeks, it compares the share of visitors who complete a purchase in each group. If the version with the delivery date converts reliably better, it becomes the new default.
03How long should an A/B test run?
Long enough to reach the sample size you calculated before starting, and for at least one full week, ideally two, so you capture weekday and weekend behaviour. Don't stop the moment results look good; checking repeatedly and stopping early is one of the most common ways to get a false result.
04What does statistically significant mean in A/B testing?
It means the difference between A and B is large enough, given your sample size, that it's unlikely to be due to random chance alone. Many teams use a 95% confidence level, often expressed as a p-value below 0.05. Significance tells you a difference is probably real, not that it's big enough to matter.
05What is the difference between A/B testing and multivariate testing?
An A/B test compares two versions that differ in one change. A multivariate test changes several elements at once, like a headline, image and button, and tests the combinations to see which mix works best. Multivariate tests need much more traffic, so most teams start with A/B tests.
06What should you not A/B test?
Skip A/B tests when you don't have enough traffic to reach a reliable result, when the change is a clear bug fix or legal requirement, when it's a big strategic change that users will need weeks to adjust to, or when splitting users would be unfair or harmful, such as different prices for identical customers without good reason.