DAU, MAU, Retention and Churn: Product Metrics Interviewers Expect
· updated
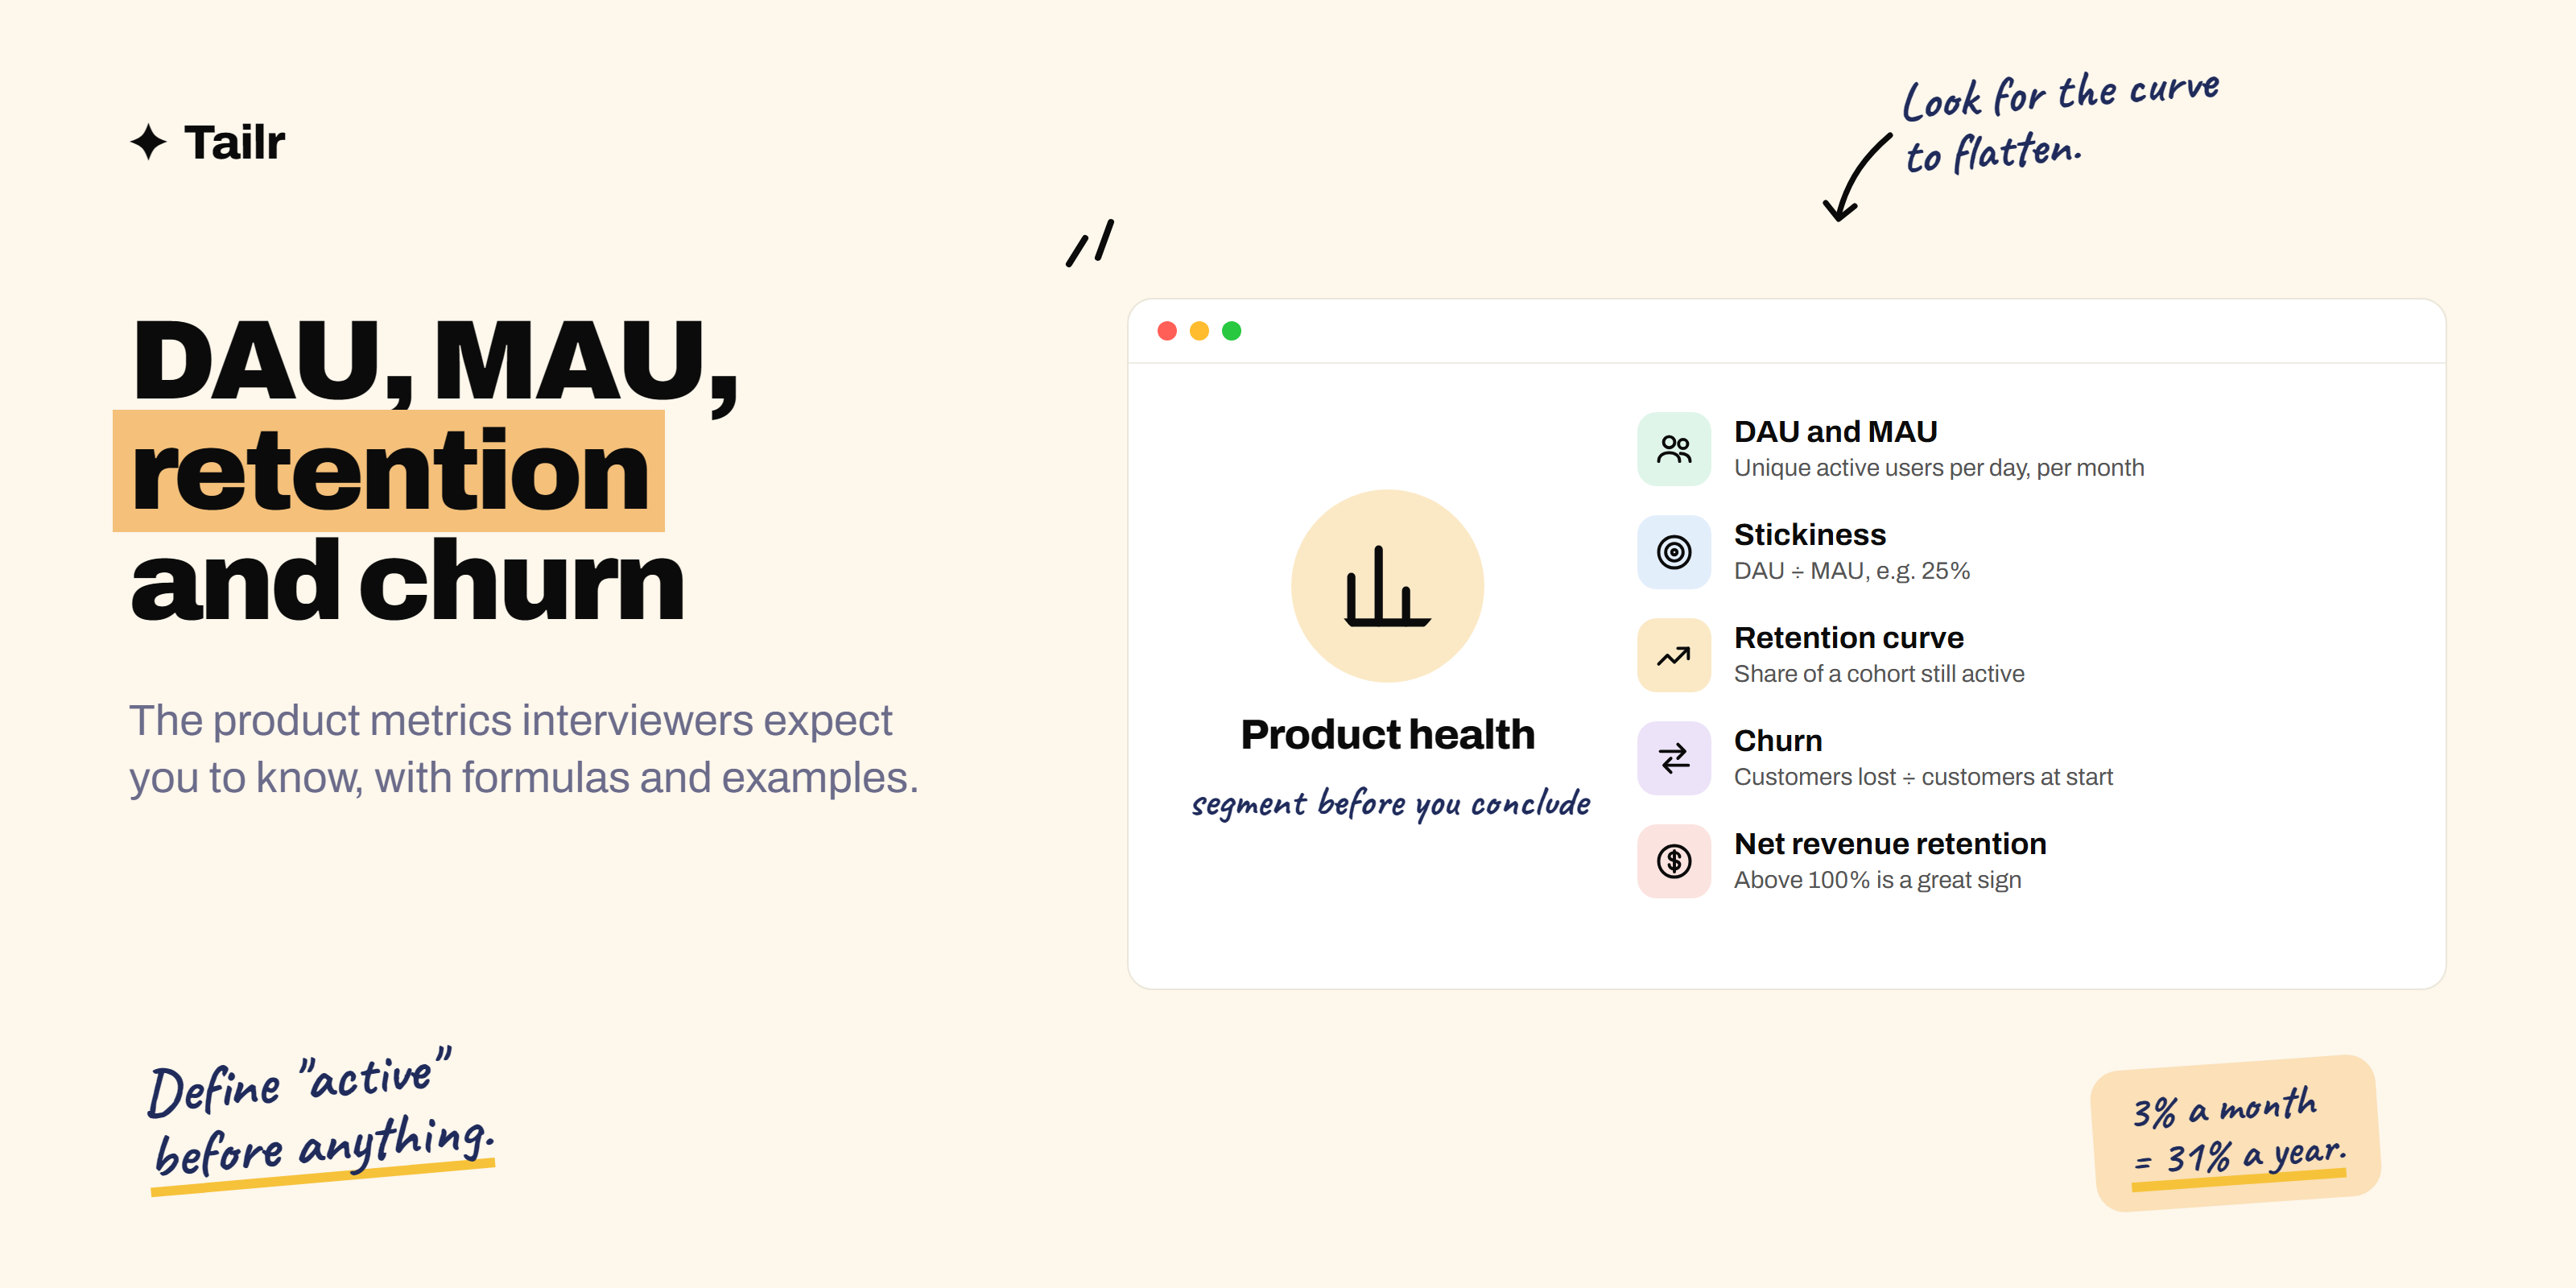
If you’re interviewing for a product role, you’ll be asked about metrics. “How would you measure success for this feature?” “DAU dropped 5% yesterday, what happened?” “Is this product healthy?” Almost every one of those answers involves the same four ideas: daily active users, monthly active users, retention and churn. This guide explains each one in plain language, shows how to calculate them, and gives you structures for the metric questions interviewers love.
The short answer: these are the core product metrics to know:
- DAU (daily active users): unique users who did something meaningful in your product on a given day.
- MAU (monthly active users): unique users active at least once in a 30-day period.
- Stickiness (DAU ÷ MAU): what share of monthly users show up on a typical day. 25% means the average user is active about 7 or 8 days a month.
- Retention: the share of users or customers who keep using the product over time, often shown as a curve by sign-up cohort.
- Churn: the share of users or customers who stop during a period. Churn = customers lost ÷ customers at the start of the period.
Retention and churn are two sides of the same coin: 95% monthly customer retention means 5% monthly churn.
First, define “active”
Before any of these numbers mean anything, you need to decide what counts as an active user. This is the most important detail, and the one interviewers most want to hear you raise.
- Weak definition: opened the app or loaded a page. This counts accidental opens, bots and people who bounced straight away.
- Strong definition: did the core thing the product exists for. Listened to a song, sent a message, completed a lesson, booked a ride, edited a document.
Two products with the same “DAU” can be in very different health depending on the definition. In an interview, say your definition out loud before you use the metric.
DAU (daily active users)
What it is: the number of unique users who were active on a given day. If one person opens a messaging app ten times in a day, they count once.
Why it matters: DAU is the clearest signal for products meant to be used daily: messaging, social media, news, fitness and habit apps. A rising DAU means more people are getting value every day.
What to watch: DAU naturally swings by day of the week. Business tools dip at weekends; entertainment apps peak at weekends. Compare a Tuesday with last Tuesday, not with yesterday, or use a 7-day average.
MAU (monthly active users)
What it is: the number of unique users active at least once in a 30-day period (or calendar month).
Why it matters: MAU shows the size of your engaged audience. It’s the headline number for products used a few times a month, like travel, shopping, banking or job search apps, where expecting daily use would be unrealistic.
There’s also WAU (weekly active users), which is often the best fit for work tools that people use on weekdays.
Stickiness: the DAU/MAU ratio
Formula: stickiness = average DAU ÷ MAU × 100
Example: 150,000 average DAU and 600,000 MAU gives 150,000 ÷ 600,000 = 25%. The average monthly user is active on about a quarter of days, roughly 7 or 8 days a month.
What’s good? It depends on the product:
| Product type | Typical expectation |
|---|---|
| Messaging and social apps | Very high; 50%+ is exceptional |
| Many consumer apps | Around 20% is often quoted as healthy |
| Work tools (weekday use) | Use WAU/MAU or exclude weekends |
| Travel, shopping, finance | Low by nature; judge on monthly retention instead |
Benchmarks vary a lot between sources, so in an interview, focus on whether a ratio makes sense for how the product is meant to be used, and on the trend, rather than quoting one universal number.
Retention
What it is: the percentage of users (or customers) who are still active after a certain time.
Cohort retention (the one interviewers mean most often)
Group users by when they signed up, called a cohort, and track what share of each cohort is active on day 1, day 7, day 30 and so on.
Example: 10,000 people sign up in the first week of March.
| Time since sign-up | Still active | Retention |
|---|---|---|
| Day 1 | 4,200 | 42% |
| Day 7 | 2,500 | 25% |
| Day 30 | 1,600 | 16% |
| Day 90 | 1,400 | 14% |
Reading the retention curve
Plot those numbers and you get a retention curve. Every curve drops at the start, because some people sign up and never come back. What matters is the shape after that:
- Flattening curve: after the early drop, it levels off (14% at day 90 above). You’ve found a group of users who keep getting value. This is one of the clearest signs of product-market fit.
- Declining to zero: the curve keeps falling. Users try the product but don’t stay. More marketing won’t fix it; you’re filling a leaky bucket.
- Smiling curve: it drops and then rises again, as some users come back. Rare and a great sign.
Comparing cohorts
The most useful view is comparing cohorts: did people who signed up in June retain better than those from March? If yes, something you changed is working.
Churn
What it is: the percentage of customers or users who stop using or paying for the product in a given period.
Customer churn rate
Formula: customers lost during the period ÷ customers at the start of the period × 100
Example: you start the month with 2,000 paying customers and 60 cancel. Churn = 60 ÷ 2,000 = 3% monthly churn.
Don’t count new customers gained during the month in the denominator; that hides real churn.
Revenue churn and net revenue retention
For subscription businesses, losing a small customer and a big customer aren’t the same. So teams also track:
- Gross revenue churn: revenue lost from cancellations and downgrades ÷ revenue at the start.
- Net revenue retention (NRR): revenue kept from existing customers, including upgrades and expansion. Above 100% means existing customers are spending more over time, even after some leave, which is a very strong sign for B2B software.
Monthly vs annual churn
Monthly churn compounds. A 3% monthly churn doesn’t mean 36% a year: with 97% kept each month, after 12 months you keep about 0.97¹² ≈ 69%, so you lose about 31% of customers a year. It’s still a lot. Small monthly improvements make a big yearly difference.
Voluntary vs involuntary churn
- Voluntary: the customer chose to leave.
- Involuntary: a payment failed, usually because a card expired. This is often a surprisingly large share of churn and one of the easiest to fix with reminders and retry logic.
Other metrics that come up alongside these
- Activation rate: the share of new users who reach the first meaningful moment, like creating a first project. Activation strongly predicts retention.
- Conversion rate: the share who move from one step to the next, such as free to paid.
- ARPU (average revenue per user).
- LTV (customer lifetime value): roughly, average revenue per customer per month ÷ monthly churn rate, for a simple subscription model.
- CAC (customer acquisition cost), and the LTV:CAC ratio.
- North star metric: the single metric that best captures customer value. See what is a north star metric.
How these come up in PM interviews
“How would you measure the success of X?”
- Clarify the goal of the product or feature.
- Define “active” for this product.
- Pick a primary metric, often a north star or a retention measure.
- Add supporting metrics: DAU or MAU for reach, stickiness for habit, retention for lasting value.
- Add a guardrail you don’t want to hurt, such as complaints, unsubscribes or performance.
Example for a new “streaks” feature in a language app: primary metric is day-30 retention of users who start a streak vs those who don’t; supporting metrics are DAU/MAU and lessons per active user; guardrail is the share of users who turn notifications off.
“DAU dropped 10% yesterday. What do you do?”
- Check the data. Did tracking break, did a definition change, was there an outage?
- Check the calendar. Holiday, weekend, a big event, a competitor launch?
- Is it sudden or gradual? Sudden suggests a bug, release or outage; gradual suggests a product or market problem.
- Segment. Platform (iOS vs Android vs web), app version, country, new vs returning users, acquisition channel.
- Look at the funnel. Are fewer people opening the app, or are they opening it and failing to do the core action?
- Form a hypothesis and decide. Roll back the release, fix the bug, or dig deeper.
Interviewers care much more about the order of your thinking than about the “right” answer.
“Our MAU is growing but revenue is flat. Why?”
Possible answers to explore: growth is from a low-value segment or free users; activation is weak so new users never reach paid features; churn among paying customers is rising and hiding behind new sign-ups; pricing or the paywall changed.
For the wider vocabulary, see 10 terms you should know before a product management interview and what are KPIs.
Worked example: a health check for a fitness app
Put the metrics together and you can describe a product’s health in a few lines. Here’s an imaginary fitness app’s month:
| Metric | Value | What it tells you |
|---|---|---|
| MAU | 500,000 | A decent-sized audience |
| Average DAU | 60,000 | |
| Stickiness (DAU/MAU) | 12% | Typical user works out with the app about 3–4 days a month: lower than a daily-habit app should be |
| Day-1 retention (latest cohort) | 38% | Many people don’t come back after the first day |
| Day-30 retention | 11%, flattening | A loyal core exists |
| Monthly paid churn | 6% | High: about half of subscribers leave within a year |
The story: people who stick around love it (the curve flattens), but too many new users drop off on day one, and paying customers leave fast. As a PM, you’d look at the first-session experience (why only 38% return) and at why subscribers cancel, perhaps with exit surveys and a look at involuntary churn from failed payments.
In an interview, walking through a table like this, and ending with “so here’s where I’d focus first”, is exactly what a strong answer sounds like.
How to improve retention and reduce churn
Interviewers often follow up with “so how would you improve it?” Useful levers:
- Get users to value faster. Shorten onboarding, pre-fill content, and guide people to the core action in their first session. Better activation is usually the biggest retention lever.
- Build a habit loop. Reminders tied to the user’s own goals, progress tracking and streaks, used carefully so they don’t become annoying.
- Find the “aha” behaviour. Look at retained users and find what they did early that churned users didn’t, such as following five accounts or completing two workouts in the first week. Then design onboarding to get everyone there.
- Fix involuntary churn. Card-expiry reminders, payment retries and easy card updates.
- Talk to people who leave. A short cancellation survey and a handful of interviews usually reveal the top two or three reasons.
- Offer alternatives to cancelling, like pausing a subscription or switching to a cheaper plan.
Common mistakes with these metrics
- Not defining “active”. The single biggest source of misleading numbers.
- Celebrating MAU while retention falls. Heavy marketing can grow MAU even as each cohort leaves faster.
- Comparing a weekday to a weekend. Use the same day last week, or a 7-day average.
- Mixing user churn and revenue churn. Losing ten small customers isn’t the same as losing one large one.
- Reading averages only. Segments almost always tell the real story.
Using these metrics in your resume
If you’ve worked with any of these numbers, put them in your resume with the before and after. “Improved day-30 retention from 18% to 24% by redesigning onboarding” is exactly the kind of line product hiring managers look for.
Then lead with whatever each listing emphasises. Growth PM roles care about activation and conversion; platform roles care about adoption; B2B roles care about churn and net revenue retention. Tailr is a Chrome extension that tailors your resume to the job listing you’re viewing, writes a matching cover letter and tracks each application, so the right numbers come first every time.
Try TailrRelated guides
Conclusion
DAU and MAU tell you how many people use your product, stickiness tells you how often, retention tells you whether they stay, and churn tells you how fast they leave. Always define “active” first, look at retention by cohort, and segment before you conclude anything. Master those habits and you’ll handle most of the metric questions in a product interview with confidence.
Frequently asked questions
01What is the difference between DAU and MAU?
DAU (daily active users) is the number of unique users who did something meaningful in your product on a given day. MAU (monthly active users) counts unique users active at least once in a 30-day period. A user active every day is counted once in MAU but on every day of DAU.
02How do you calculate the DAU/MAU ratio?
Divide average daily active users by monthly active users and express it as a percentage. With 150,000 average DAU and 600,000 MAU, the ratio is 25%, meaning the typical monthly user is active on about a quarter of days, roughly 7 or 8 days a month. This ratio is often called stickiness.
03What is a good DAU/MAU ratio?
It depends on how often the product is meant to be used. Around 20% is often quoted as healthy for many apps, and 50% or more is exceptional, usually seen in messaging and social apps. A travel or tax app will naturally be much lower, so compare against similar products rather than a universal number.
04How do you calculate churn rate?
Customer churn rate is the number of customers lost during a period divided by the number of customers at the start of that period. If you start the month with 2,000 customers and lose 60, monthly churn is 60 ÷ 2,000 = 3%. Don't count new customers gained during the period in the denominator.
05What is the difference between retention and churn?
They're two sides of the same measure. Retention is the share of users or customers you keep over a period; churn is the share you lose. For the same group and period, customer retention rate plus churn rate equals 100%, so 95% monthly retention means 5% monthly churn.
06What is a retention curve?
A retention curve plots the percentage of a cohort of users still active on each day or week after they first signed up. It almost always drops at first. If it flattens out at some level, you have a core group of users who keep coming back, a strong sign of product-market fit. If it keeps falling toward zero, users aren't finding lasting value.