What Are KPIs? A Plain-English Guide With Examples
· updated
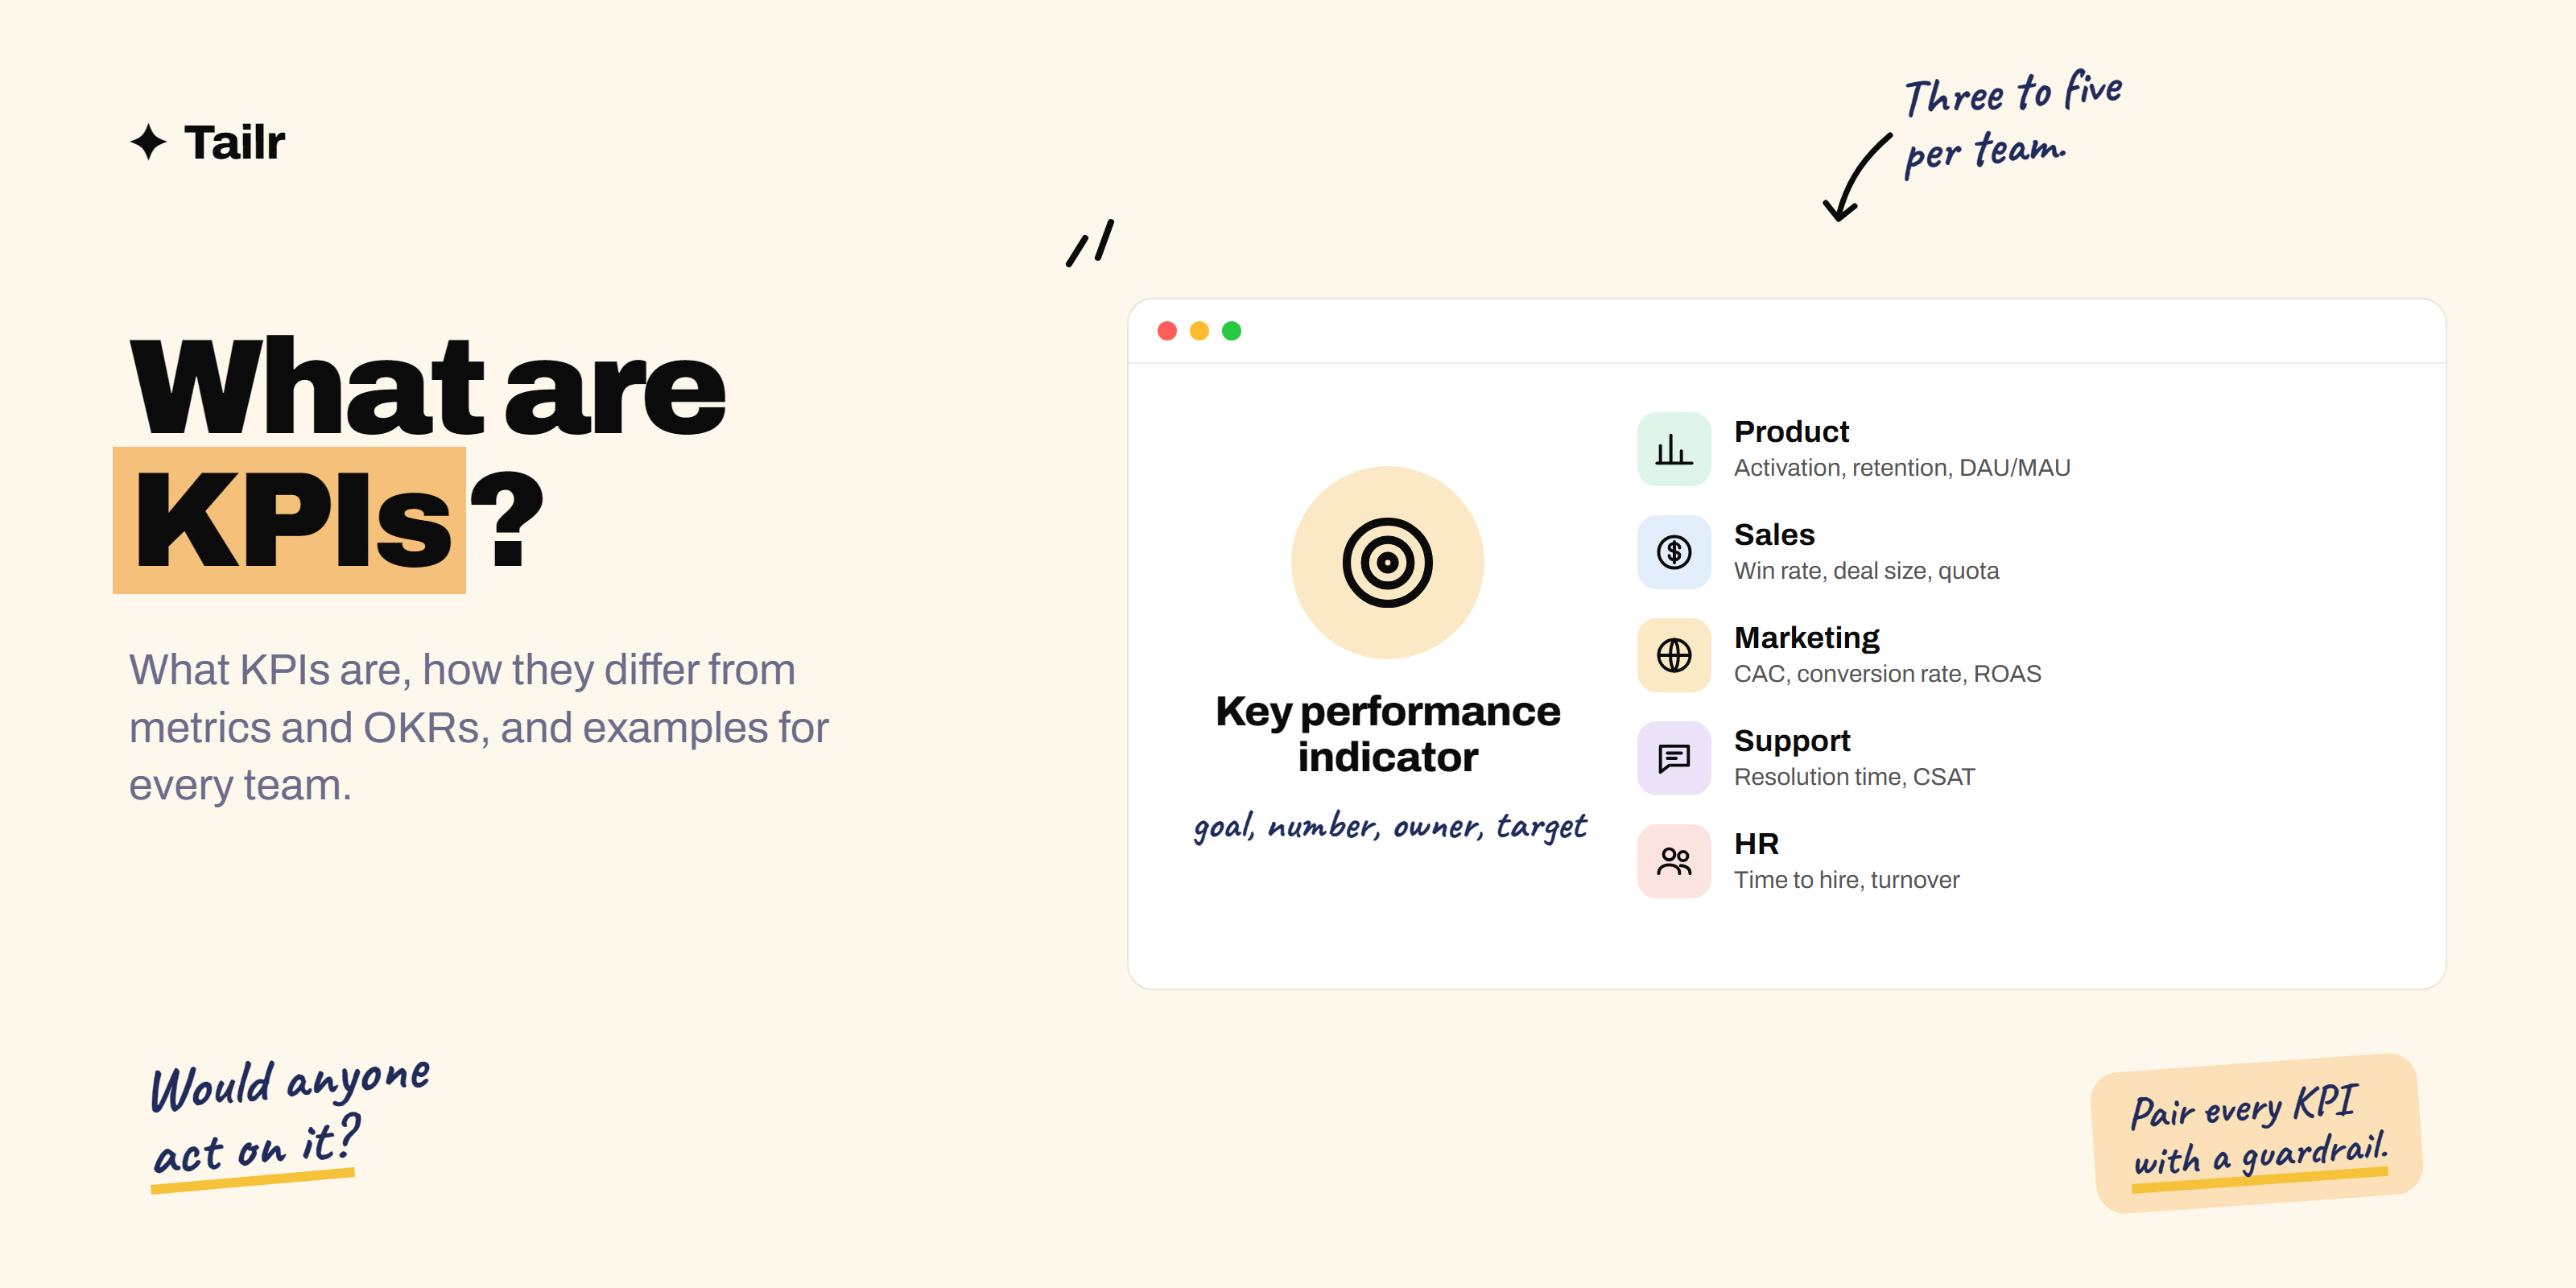
KPI is one of those terms that shows up everywhere: in job descriptions, performance reviews, interview questions and every second slide in a company meeting. It’s simpler than it sounds. This guide explains what KPIs are, how they’re different from metrics and OKRs, gives real examples for different teams, and shows how to talk about them in an interview.
The short answer: a KPI (key performance indicator) is a measurable number that shows whether a person, team or company is on track toward an important goal. A good KPI is:
- Tied to a goal: it measures progress toward something that actually matters.
- Measurable: it’s a specific number with a clear definition.
- Owned: someone is responsible for it.
- Targeted: it has a target and a time frame, such as “reduce churn to 3% a month by March”.
- Actionable: if it moves, someone changes what they’re doing.
Examples include monthly recurring revenue, customer churn rate, conversion rate, daily active users and average support resolution time.
What does KPI stand for?
KPI stands for key performance indicator. Each word does work:
- Key: it’s one of the few numbers that matter most, not one of hundreds you could track.
- Performance: it measures how well something is going.
- Indicator: it signals progress, though it doesn’t tell the whole story on its own.
KPI vs metric: what’s the difference?
This is the most common point of confusion. A metric is any measurement: page views, logins, emails sent. A KPI is a metric you’ve promoted because it’s directly tied to a goal you care about.
| Metric | KPI | |
|---|---|---|
| What it is | Any number you can measure | A metric chosen as critical to a goal |
| How many | Hundreds | A handful per team |
| Has a target? | Not necessarily | Yes |
| Has an owner? | Not necessarily | Yes |
| Example | Total app opens | Weekly users who complete a booking |
A useful test: if this number changed tomorrow, would anyone do anything differently? If the answer is no, it’s a metric, not a KPI.
KPIs vs OKRs
People often mix these up too. KPIs track the ongoing health of something, like a car’s dashboard. OKRs (objectives and key results) are time-boxed goals to change something, like a route for a specific trip.
You’ll often see them working together: a KPI shows a problem (“churn has risen to 6%”), and the team sets an OKR to fix it (“Objective: keep customers longer. Key result: cut monthly churn from 6% to 4% this quarter”). We cover this fully in OKRs vs KPIs.
Types of KPIs
There’s no single official list, but these groupings are the ones you’ll hear most:
Leading vs lagging KPIs
- Lagging KPIs report results that have already happened: revenue last quarter, customers lost last month. They’re accurate but arrive too late to change.
- Leading KPIs predict future results: trial users who complete setup, sales demos booked. They’re less certain but give you time to act.
Good teams track both. If you only watch lagging KPIs, you find out about problems after the damage is done.
Strategic, operational and functional KPIs
- Strategic KPIs show the overall health of the company: revenue growth, profit margin, market share.
- Operational KPIs track day-to-day efficiency: order fulfilment time, system uptime.
- Functional KPIs belong to one team: marketing’s cost per lead, HR’s time to hire.
Input, output and outcome KPIs
- Input: effort and resources (sales calls made, ad spend).
- Output: what the work produced (features shipped, leads generated).
- Outcome: the result that actually matters (revenue, retention, customer satisfaction).
Outcome KPIs are usually the most important, but input and output KPIs help explain why an outcome moved.
KPI examples by team
Product KPIs
- Daily and monthly active users (DAU, MAU): how many people use the product. See DAU, MAU, retention and churn explained.
- Activation rate: the share of new users who reach the first moment of real value.
- Retention rate: the share of users still active after 7, 30 or 90 days.
- Feature adoption: the share of active users using a specific feature.
- North star metric: the one number that best captures customer value. See what is a north star metric.
Sales KPIs
- Revenue against quota: how much a rep or team sold compared with the target.
- Win rate: deals won ÷ deals that reached a decision.
- Average deal size.
- Sales cycle length: days from first contact to signed deal.
- Pipeline coverage: value of open deals compared with the target.
Marketing KPIs
- Customer acquisition cost (CAC): total sales and marketing spend ÷ new customers.
- Cost per lead.
- Conversion rate: visitors who sign up, or leads who become customers.
- Return on ad spend (ROAS).
- Organic traffic from search.
Customer success and support KPIs
- Net revenue retention (NRR): revenue kept from existing customers, including upgrades and losses.
- Customer churn rate.
- Customer satisfaction (CSAT) and net promoter score (NPS).
- First response time and average resolution time.
Finance KPIs
- Monthly recurring revenue (MRR) and annual recurring revenue (ARR).
- Gross margin.
- Burn rate and runway for startups.
- Customer lifetime value (LTV) and the LTV:CAC ratio.
HR and recruiting KPIs
- Time to hire: days from opening a role to an accepted offer.
- Offer acceptance rate.
- Employee turnover and retention.
- Quality of hire, often measured by performance or retention after a year.
Engineering and QA KPIs
- Deployment frequency and lead time for changes.
- Change failure rate and time to restore service.
- Escaped defects: bugs found by users rather than in testing.
- Uptime.
How to set good KPIs
Use the SMART check
A useful KPI is specific, measurable, achievable, relevant and time-bound.
- Weak: “Improve customer happiness.”
- Better: “Raise CSAT on support tickets from 82% to 88% by the end of Q2.”
Start from the goal, not the data
Don’t open your analytics tool and pick numbers that look interesting. Write the goal first (“customers should get value in their first week”), then ask which number would prove it (“share of new accounts that complete setup within seven days”).
Pair KPIs to avoid gaming
Any KPI can be gamed if it’s watched alone. Support can cut resolution time by closing tickets too early. Pair it with a counter-metric like CSAT or reopen rate so speed doesn’t come at the cost of quality.
Define the KPI precisely
“Active user” means nothing until it’s defined. Is it anyone who opens the app, or someone who completes a core action? Write the definition down so everyone’s looking at the same number.
Review and retire
KPIs should change as goals change. A startup’s early KPI might be weekly active teams; a year later, paid conversion. If a KPI hasn’t influenced a decision in months, replace it.
Worked example: KPIs for a small online shop
Definitions are easier with a real case. Say you run a small online shop selling handmade candles, and your goal for the year is “grow profitably without burning out”.
- Start from the goal. Profitable growth means more revenue, healthy margins and customers who come back.
- Pick one primary KPI: monthly profit, because revenue alone could grow while discounts eat the margin.
- Add supporting KPIs that explain movement:
- Conversion rate: visitors who buy. Tells you if the shop and product pages work.
- Average order value: tells you whether bundles and upsells are working.
- Repeat purchase rate: the share of customers who buy again within 90 days.
- Add one leading KPI: email sign-ups per week, since your email list drives most repeat sales.
- Add a guardrail: hours worked per week, because “without burning out” is part of the goal.
Five numbers, each with a reason. When profit dips, you can check which of the supporting KPIs moved and act on that one, instead of guessing.
How to calculate common KPIs
| KPI | Formula | Example |
|---|---|---|
| Conversion rate | Conversions ÷ visitors × 100 | 120 orders ÷ 4,000 visitors = 3% |
| Customer churn rate | Customers lost in period ÷ customers at start × 100 | 30 ÷ 1,000 = 3% a month |
| Customer acquisition cost (CAC) | Sales and marketing spend ÷ new customers | $9,000 ÷ 300 = $30 |
| Average order value | Revenue ÷ number of orders | $6,000 ÷ 120 = $50 |
| Customer lifetime value (simple) | Average monthly revenue per customer ÷ monthly churn | $20 ÷ 0.03 ≈ $667 |
| Net promoter score (NPS) | % promoters (9–10) − % detractors (0–6) | 55% − 15% = 40 |
| Gross margin | (Revenue − cost of goods) ÷ revenue × 100 | ($50k − $20k) ÷ $50k = 60% |
Always write down which time period and which customers each KPI covers. “Churn” for monthly subscribers and “churn” for annual subscribers are different numbers.
How KPIs are tracked and reported
Most teams follow a simple rhythm:
- A dashboard that shows each KPI, its target and its trend over time. This can be anything from a spreadsheet to a business intelligence tool.
- A regular review, weekly for fast-moving KPIs like sign-ups and monthly for slower ones like churn.
- A short written note with each review: what moved, why we think it moved, and what we’ll do about it.
- Clear ownership: one name next to each KPI, so there’s no confusion about who follows up.
The note matters more than the chart. A KPI that’s reviewed without anyone deciding anything is just decoration.
Common KPI mistakes
- Too many KPIs. Twenty “key” indicators means none of them are key.
- Vanity metrics. Total sign-ups and page views go up and to the right but often say little about real value.
- No owner. A KPI nobody’s responsible for will drift.
- Only lagging KPIs. By the time revenue drops, the cause happened months ago.
- Targets without context. “Grow 20%” with no reason or baseline isn’t a plan.
How KPIs come up in job interviews
KPIs appear in interviews in two ways.
1. “Which KPIs would you track for X?” This is common in product, marketing, operations and analyst interviews. A strong structure:
- Clarify the goal of the product or feature.
- Name one primary KPI tied to that goal.
- Add two or three supporting KPIs that explain movement.
- Add a guardrail metric you don’t want to hurt.
For example, for a new “save for later” feature in a shopping app: the primary KPI is the share of saved items that are later purchased; supporting KPIs are feature adoption and return visits; the guardrail is overall checkout conversion, because you don’t want people saving instead of buying.
2. “Tell me about a time you improved a KPI.” Use the STAR method and lead with the number: “Our onboarding completion was 41%. I ran interviews, found that the third step confused people, and we cut it. Completion rose to 58% in six weeks.”
If you’re preparing for product interviews, our 10 terms to know before a product management interview puts KPIs alongside the other vocabulary you’ll need.
Put KPIs on your resume
Hiring managers scan resumes for numbers. Turning your duties into KPIs you moved is the single fastest way to make a resume stronger.
- Before: “Responsible for customer support emails.”
- After: “Cut average first-response time from 9 hours to 2 hours while keeping CSAT above 90%.”
Then match those achievements to the KPIs each job listing mentions. If a listing talks about “retention” and “activation”, lead with the bullet points where you moved those. Tailr helps here: the Chrome extension reads the job listing you’re viewing and tailors your resume to it, so your most relevant numbers come first. Our guide to resume keywords covers the rest.
Try TailrConclusion
A KPI is a number you’ve chosen because it shows whether you’re winning at something important. Keep the list short, define each one precisely, pair them so they can’t be gamed, and mix leading indicators with lagging ones. Whether you’re setting goals for a team or answering “which KPIs would you track?” in an interview, the same rule applies: start from the goal and pick the few numbers that prove you’re reaching it.
Frequently asked questions
01What is a KPI in simple words?
A KPI, or key performance indicator, is a number that shows whether you're on track toward an important goal. A business, team or person picks a small set of KPIs, such as monthly revenue, customer churn or tickets resolved, and checks them regularly to decide what to do next.
02What is the difference between a KPI and a metric?
A metric is any number you can measure, such as page views or app opens. A KPI is a metric you've chosen as critical to a goal, with a target and an owner. Every KPI is a metric, but most metrics aren't KPIs. If you wouldn't change a decision based on a number, it isn't a KPI.
03What are examples of KPIs?
Common KPIs include monthly recurring revenue, customer acquisition cost, customer churn rate, net promoter score, conversion rate, daily active users, average resolution time for support tickets, and on-time delivery rate. The right KPIs depend on the goal: a sales team, a product team and a support team track very different ones.
04What are the 4 types of KPIs?
A common way to group them is: strategic KPIs (big-picture company health like revenue or market share), operational KPIs (day-to-day efficiency like delivery time), functional KPIs (specific to one team like marketing or HR), and leading or lagging KPIs (predicting future results vs reporting past ones). Other lists use input, output and outcome KPIs.
05How many KPIs should a team have?
Usually three to five per team. Fewer than three can miss important trade-offs; more than five or so and nobody can remember them, so none get real attention. A company-level dashboard can have more, but each team should own a short list.
06What does KPI mean in a job description?
When a job description mentions KPIs, it's telling you how you'll be judged, for example 'own KPIs for activation and retention' or 'meet monthly sales KPIs'. In your resume and interview, show results against similar numbers: what you moved, by how much, and over what time.